Hello! Welcome! Make yourself comfortable. This little tutorial will help you get to grips with d3-annotation. Begin with the start folder and edit the index.html file. If you get stuck, have a look in the individual exercise folders for the answers.
Open the start folder. In the folder, there's a standard bar chart. There is a bit of space for annotations though. If we look through the code, we have some extra bits
var annotations = [  ]

var makeAnnotations = d3.annotation()
.accessors({
    x: function(d){return x(d.x)+margin.left},
    y: function(d){return y0(d.y)+margin.top}
})
.annotations(annotations)

d3.select("svg")
    .append("g")
    .attr("class", "annotation-group")
    .call(makeAnnotations)
This contains everything you need to implement d3-annotations. Let's break it down a bit.
var annotations = [ ] is an array of objects that contains the information for each annotation.
makeAnnotations is the annotations component. It's a bit similar to how we set up an axis, for example we set up var xAxis=d3.axisBottom(x), before calling it svg.append('g').call(xAxis).
Also similar to setting up scales (e.g. x = d3.scaleLinear().range([0 , chart_width]).domain([0,100]) , we set up accessor functions to translate from data to pixels on the svg.
Because we are appending a g directly to the svg, we need the x and y position to take into account the scales we've used and the chart margins.
.annotations(annotations) uses the annotations we declared previously.
Lastly we call the annotation component to draw the annotations on to the svg.
Let's add our first annotation. To the annotations array, add the following object.
{
    type:d3.annotationLabel,
    note: {
        label: "My first annotation",
        wrap: x(40)-x(29),
    },
    data:{
        x: 29,
        y: "0–4 hours per week"
    },
    dx:50,
    dy:50
}
Note: If you are typing out these bits of code, the line between 0 and 4 is not a hyphen, it's an en-dash which is used when referring to a range of numbers.
Refresh the page and you should see your first annotation.
Let's go through the contents of our object. There are a set number of annotation types you can specify in the type property. If all the annotations are the same type, you can save yourself some typing by declaring the type in the makeAnnotations component.
The note property is an object that describes what to show. Here we've used label and wrap. Here wrap is based off the data so will cause the annotation to wrap responsively. We could have put a pixel value in. We could have also specified the title orbgPadding as properties of the note object.
The data property is an object with the x and y position of the data point the annotation is referring to. d3-annotation uses the accessors specified early to get the pixel positions. Note, these properties are the ones referred to above from the accessors.
Both dx and dy specify where it relation to the data point the annotation should go. Here we're moving 50 pixels to the right and 50 pixels down. We could have used something bound to the data if we wanted here, e.g. dy:y0.bandwidth().
We can use the different annotation types for different annotations.
Let's add an additional annotation to our chart. Let's add the following object to the annotations array.
{
	type:d3.annotationCalloutRect,
	note: {
		title: "Look at this region"
	},
	data: {
		x:30,
		y: "10–19 hours per week"
    },
	dy: 25,
	dx: 60,
	subject: {
		width: 50,
		height: y0.bandwidth()
	}
}
Here everything is pretty much the same except we've used a different type, used the title property instead of the label and we have a subject this time. The annotation moves away by dx,dy and starts a rectangle with height and width properties set in the subject object. Again these can be set with data values or pixels, and they can also be set to negative.
Add another object to the annotations array.
{
    type:d3.annotationXYThreshold,
    note: {
  	  label: "Reference line",
    },
    data: { x: 28.5, y: "10–19 hours per week" },
    dy:-10,
    dx:10,
    subject: {
	    y1: margin.top,
    	y2: margin.top+height
    }
}
Here we've used the d3.annotationXYThreshold type. For this type, the subject takes y1 and y2 as properties. It could be x1 or x2 for horizontal a horizontal line.
Another object to add to the annotations array. This time we are using d3.annotationCalloutCircle.
{
    type:d3.annotationCalloutCircle,
    note: {
    	title: "Oooh!",
    },
    data: { x: 35, y: "0–4 hours per week" },
    dx: 10,
    subject: {
    	radius: 7,
        radiusPadding: 0
    }
}
Here the subject takes a radius and radiusPadding.
Hopefully the past few exercises have given you an idea of how d3.annotations are put together. Now some exercises to customise the annotations.
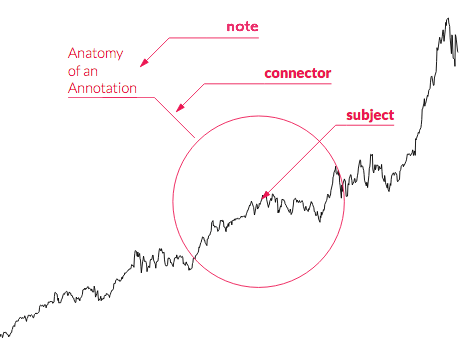
There are three main parts to annotations: subject, connector, note.
To disable any of these, add the disable property to the annotation object and pass it an array with strings connector, subject or note. Let's do this for the last annotation we added, our callout circle annotations.
Add
"disable":["note","connector"]to our object. And now only the subject should be left.
Let's add an arrow to first annotation so it's pointing to something. Add a new connector property to the first annotation object.
"connector":{"end":"arrow"}Here the connector property takes an object with the property end and the option arrow. We could have used dot too.
Change the annotation type to d3.annotationCalloutElbow if you want the connector to draw lines at 45 and 90 degree angles.
For curvy lines, there are a couple more properties to set in the connector. Use this as the connector property for the annotation.
"connector":{
    "end":"arrow",
    "type":"curve",
    "points":[[30,10]],
    "curve":d3.curveBasis
}
Here we are specifying that the type of connector is a curve. Other options include line or elbow. For points we specify either a number of points or an array of arrays with x,y coordinates of the points relative to the data point. Lastly we specify what type of curve to use, here we are using d3.curveBasis to get a smooth curve. Other options include d3.curveLinear, d3.curveStep or by default it forces the curve to pass through that point.
The other possibility for curved lines is using the type d3.annotationCalloutCurve.
Often we feel the need to change the position of where the line meets the text. By default, this is done dynamically to the top centre or bottom centre depending on whether dy is negative or positive.
You can have a bit more manual control by specifying align and lineType in the note object. It will always go to the side nearest the data point. Let's change our reference line annotation so the text is in the middle. For the note object we now have.
note: {
	label: "Reference line",
	align:"middle",
	lineType:"horizontal"
}
If we wanted to get rid of the line underneath the annotation, we can use some CSS in the head styles.
path.note-line{
    opacity:0
}
Here's a little reference table to what options to use to change the placement of the line.
| Placement | align | lineType |
|---|---|---|
| Top/Bottom and left | left | horizontal |
| Top/Bottom and centre | middle | horizontal |
| Top/Bottom and right | right | horizontal |
| Left/Right and top | top | vertical |
| Left/Right and centre | middle | vertical |
| Left/Right and bottom | bottom | vertical |
One approach suggested for dealing with responsive annotations is to use badges for small screen sizes (see example). Because of the way the annotations are created we only need to make a different annotations array for mobile. We can use our break points already set in the config to help us too. Let's now set up the if-else condition.
if (parseInt(graphic.style("width")) >= threshold_sm) {
	//wide screen annotations
    var annotations = [...]
}else{
    //narrow screen annotations
    var annotations = [...]
}
For the mobile annotations, we can use a new type d3.annotationBadge. Let's just replicate the first annotation in our new mobile style and put it in the mobile section.
var annotations = [{
    x: x(29.0)+margin.left,
    y: y0("0–4 hours per week")+y0.bandwidth()/2+margin.top,
    type:d3.annotationBadge,
    subject:{text:"A",radius:14,x:"right"}
}]
Here we are using x and y directly rather than using the accessors. The subject for d3.annotationBadge takes a few properties. text is what's displayed in the badge. This for example could be a country code or a number for a data point. The radius sets the radius of the circle and the x property takes right or left as options and points the badge point one way or another. You can also set a y property to top or bottom to make the badge point up and down. If you use both x and y it will make diagonally pointing badges.
Great, we've added badges for mobile. Now we need to add a legend at the bottom too to explain what the badge means. This is based off another d3-annotation example.
We are going to need another array defined in the mobile part of the if else loop for the legends
var annotationLegend = [{
        note:{label:"My first annotation"},
        subject:{text:"A",x:"right"},
        x:10,
        y:10
}]
We are creating another set of badges but in a g element below the chart so the x and y refer to the g.
We can use another conditional statement if the screensize is narrow to make the legend at the bottom. We can add this after we've added the first set of annotations.
if (parseInt(graphic.style("width")) < threshold_sm) {
    var makeLegendAnno = d3.annotation()
              .type(d3.annotationBadge)
              .annotations(annotationLegend)

          d3.select("svg")
                .append('g')
                .attr("class","annotation-legend")
                .attr("transform","translate(0 "+(height+margin.top+margin.bottom)+")")
                .call(makeLegendAnno)

          d3.select("svg g.annotation-legend")
            .selectAll("text.legend")
            .data(annotationLegend)
            .enter()
            .append('text')
            .attr("class","legend")
            .text(function(d){return d.note.label})
            .attr("x",50)
            .attr("dy",0)
            .attr("y", function(d,i){return 14+i*60})
            .call(wrap,chart_width+margin.left-50)
}
And finally, we just need to extend the height of svg for our new legend. For this chart template the height is set in the createLegend function.
Replace
d3.select('#chart').attr("height", height + margin.top + margin.bottom + legend_height.height)with
if (parseInt(graphic.style("width")) > threshold_sm) {
	d3.select('#chart').attr("height",  height + margin.top + margin.bottom + legend_height.height)
}else{
    d3.select('#chart').attr("height",  height + margin.top + margin.bottom + legend_height.height+30)
}Let's add some tooltips to the bars that show what data values they have.
First let's create two functions, showTooltip and hideTooltip.
function showTooltip(d){}

function hideTooltip(){}
Let's bind them to some events. In this example, when we draw the bars we can add mouseover and mouseout.
var state = svg.selectAll(".state")
        .data(graphic_data)
        .enter()
        .append("g")
        .attr("class", "g")
        .attr("transform", function(d,i) { return "translate(0,"  + parseFloat(y0(d.state))  + ")"; })
        .on("mouseover",function(d){showTooltip(d)})
        .on("mouseout",function(){hideTooltip();});
Let's add a g element for our tooltip to live in
tipg = svg.append("g")
    	.attr("class", "annotation-tip");
And finally some CSS to turn pointer events off and styling
.annotation-tip{
    pointer-events: none;
}

.annotation-tip .annotation-note-bg {
  fill:white;
  fill-opacity:0.9;
}
Now we can fill in our functions. The tooltip is based off this example. Inside showTooltip function we can add something that creates an annotation based off the data bound to the HTML element we are mousing over.
annotationtip = d3.annotation()
        .type(d3.annotationLabel)
        .annotations([d].map(function(d){
          return {
            y:y0(d.state)+y0.bandwidth()/4,
            x:x(+d["Sandwich carers"])/2,
            dx: 0,
            dy: 0,
            note: {
               title: d3.format(".1f")(d["Sandwich carers"])+"%",
               wrap:200,
               bgPadding: {top:4,right:3,left:3,bottom:-5},
            },
            disable:["connector","subject"]
          };
        }))
The only new thing is the custom background padding around the number. Then call what we've just made
tipg.call(annotationtip);
And just for a final flourish, make the corners rounded.
d3.select(".annotation-tip").selectAll("rect.annotation-note-bg").attr("rx",5).attr("ry",5)And then to finish the tooltip, remove everything in the tipg in the hideTooltip function.
tipg.selectAll("g").remove();Well done! You've made it to the end 🎉
Have a read of the documentation for more options https://d3-annotation.susielu.com/ and Susie Lu's blogpost for version 2.
You can use className in the annotation object to specify a class for that annnotation.