


This project is part of the @thi.ng/umbrella monorepo.
Text based canvas, drawing, tables with arbitrary formatting (incl. ANSI/HTML).
ALPHA - bleeding edge / work-in-progress
yarn add @thi.ng/text-canvas// ES module
<script type="module" src="https://unpkg.com/@thi.ng/text-canvas?module" crossorigin></script>
// UMD
<script src="https://unpkg.com/@thi.ng/text-canvas/lib/index.umd.js" crossorigin></script>Package sizes (gzipped, pre-treeshake): ESM: 5.35 KB / CJS: 5.65 KB / UMD: 5.37 KB
- @thi.ng/api
- @thi.ng/arrays
- @thi.ng/geom-clip-line
- @thi.ng/math
- @thi.ng/memoize
- @thi.ng/transducers
- tslib
Several demos in this repo's /examples directory are using this package.
A selection:
| Screenshot | Description | Live demo | Source |
|---|---|---|---|
 |
3D wireframe textmode demo | Demo | Source |
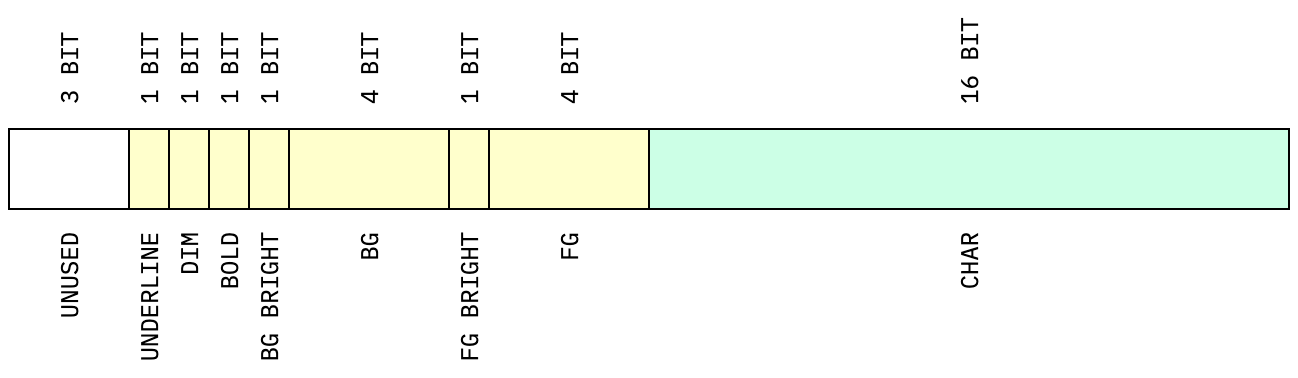
const c = canvas(width, height, format?, style?);The text canvas stores all characters in a Uint32Array with the lower
16 bits used for the UTF-16 code and the upper 16 bits for abitrary
formatting data. The package provides its own format
IDs
which are tailored for the bundled ANSI & HTML formatters, but users are
free to choose use any other system (but then will also need to
implement a custom string formatter impl).
The default format ID layout is as shown:
Most drawing functions accept an optional format arg, but a default
format can also be set via setFormat(canvas, formatID).
List of built-in format IDs:
These color IDs MUST be prefixed with either FG_ (foreground) or BG_
(background):
BLACKREDGREENYELLOWBLUEMAGENTACYANGRAYWHITELIGHT_GRAYLIGHT_REDLIGHT_GREENLIGHT_YELLOWLIGHT_BLUELIGHT_MAGENTALIGHT_CYAN
BOLDDIMUNDERLINE
Format IDs can be combined via the binary OR operator (|), e.g.:
setFormat(canvas, FG_BLACK | BG_LIGHT_CYAN | BOLD | UNDERLINE);Canvas-to-string conversion is completely customizable via the
StringFormat
interface
and the following presets are supplied:
FMT_ANSI16- translate built-in format IDs to 4bit ANSI escape sequencesFMT_ANSI_RAW- verbatim use of format IDs to ANSI sequencesFMT_HTML_INLINE_CSS- HTML<span>elements with inline CSSFMT_HTML_TACHYONS- HTML<span>elements with Tachyons CSS class names
// Terminal
console.log(toString(canvas, FMT_ANSI16));

// Browser
const el = document.createElement("pre");
el.innerHTML = toString(canvas, FMT_HTML_TACHYONS);Built-in style presets:
STYLE_ASCIISTYLE_THINSTYLE_THIN_ROUNDEDSTYLE_DASHEDSTYLE_DASHED_ROUNDEDSTYLE_DOUBLE
Functions:
beginStyle(canvas, style)endStyle(canvas)
All drawing operations are constrained to the currently active clipping rect (by default full canvas). The canvas maintains a stack of such clipping regions, each newly pushed one being intersected with the previous top-of-stack rect:
beginClip(canvas, x, y, w, h)- push new clip rectendClip(canvas)- restore previous clip rect
┌──────────────────┐
│ A                │
│         ╔════════╗─────────┐
│         ║        ║         │
│         ║ A & B  ║         │
│         ║        ║         │
└─────────╚════════╝         │
          │                B │
          └──────────────────┘
-
line -
hline -
vline -
circle -
clear -
fillRect -
strokeRect
blitresizeextractscrollVimage
textLinetextLinestextColumntextBox
The following are string builders only, draw result via text functions:
barHorizontalbarVerticalbarChartHStrbarChartVStr
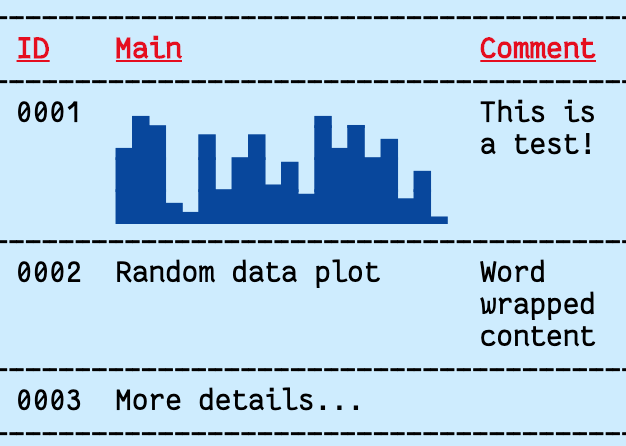
Tables support individual column width, automatic (or user defined) row heights, cell padding, as well as global and per-cell formats and the following border style options:
| Border style | Result |
|---|---|
Border.ALL |
 |
Border.NONE |
 |
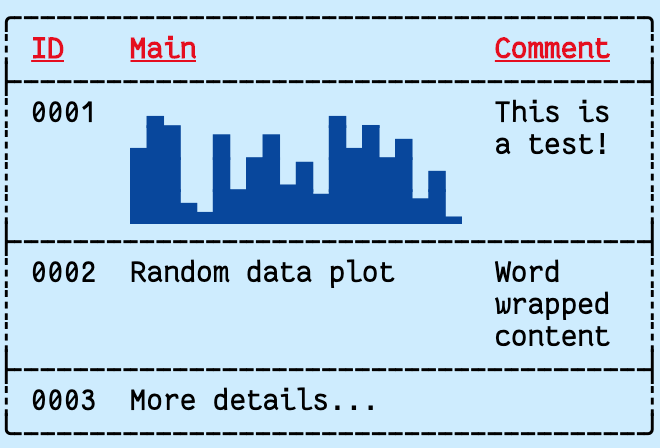
Border.H |
 |
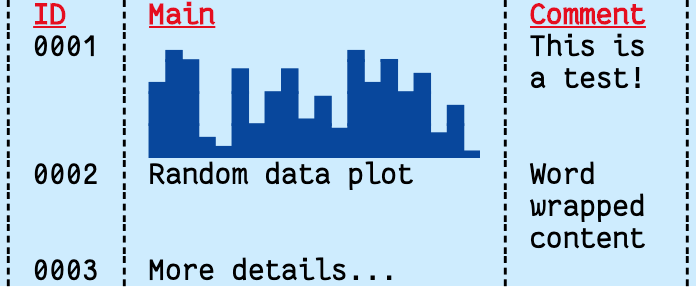
Border.V |
 |
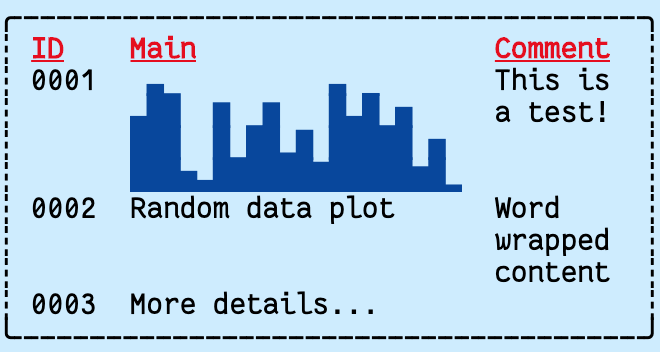
Border.FRAME |
 |
Border.FRAME_H |
 |
Border.FRAME_V |
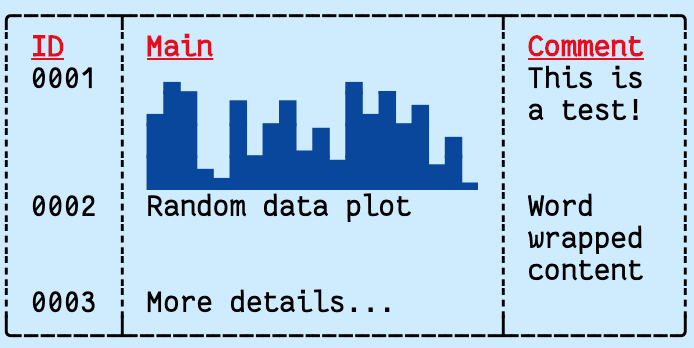 |
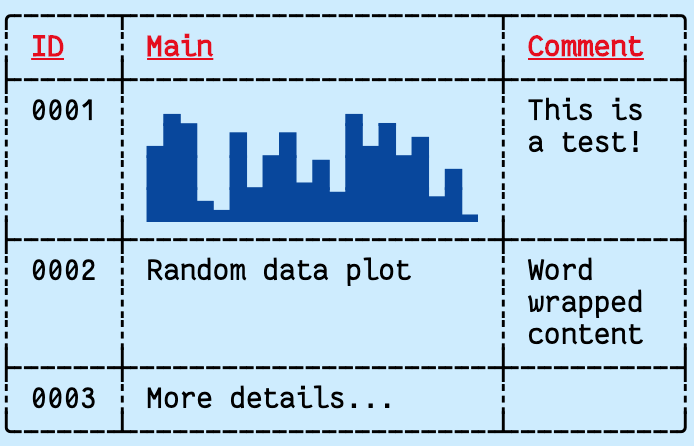
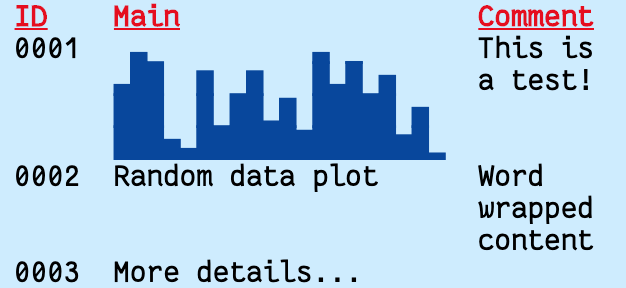
import { repeatedly } from "@thi.ng/transducers";
import * as tc from "@thi.ng/text-canvas";

// generate 20 random values
const data = repeatedly(() => Math.random(), 20)
// format as bar chart string
const chart = tc.barChartHStr(4, data, 0, 1);

// create text canvas
const canvas = new tc.Canvas(64, 20);

// create table
tc.table(
    canvas,
    0,
    0,
    {
        // column defs
        cols: [{ width: 4 }, { width: 20 }, { width: 8 }],
        // default cell format
        format: tc.FG_BLACK | tc.BG_LIGHT_CYAN,
        // default format for header cells (1st row)
        formatHead: tc.FG_RED | tc.BG_LIGHT_CYAN | tc.BOLD | tc.UNDERLINE,
        // border line style
        style: tc.STYLE_DASHED_ROUNDED,
        // border mode
        border: tc.Border.ALL,
        // internal cell padding [h,v]
        padding: [1, 0]
    },
    // table contents (row major)
    // each cell either a string or RawCell object
    [
        ["ID", "Main", "Comment"],
        [
            "0001",
            { body: chart, format: tc.FG_BLUE | tc.BG_LIGHT_CYAN },
            "This is a test!"
        ],
        ["0002", "Random data plot", "Word wrapped content"],
        ["0003", { body: "More details...", height: 4 }, ""]
    ]
);

// output as ANSI formatted string
console.log(tc.toString(canvas, tc.FMT_ANSI16));
For even more detailed control, tables can also be pre-initialized prior
to creation of the canvas via
initTable()
and then drawn via
drawTable().
The initTable function returns an object also containing the computed
table size (width, height keys) which can then be used to create a
canvas with the required size...
For convenience, the tableCanvas() function can be used to combine
these steps and to create an auto-sized canvas with the rendered table
as content.
       ┌───┐
  ┌──────────────────────┐
  │ @thi.ng/text-canvas  │
  │ wireframe cube       │++++++++++
  │                      │          +++++++++++    ┌───┐
  │ x: 0.42              │                     ++++│ 6 │
  │ y: 0.30              │        ┌───┐ ++++++++   └───┘
  └──────────────────────┘++++++++│ 7 │+           +
           +         └───┘        └───┘            +
            +          +           +              +
            +          +           +              +
             +         +           +             +
             +         +          +              +
             +          +         +              +
              +         +         +             +
              +         +         +             +
               +        +        ┌───┐         +
               +         +      +│ 3 │         +
                +       ┌───┐+++ └───┘        +
                +       │ 0 │       +         +
                 +      └───┘        +        +
                 +       +            +      +
                 +       +             +     +
                  +     +               +   +
                  +     +                +  +
                   +    +                 ┌───┐
                   +    +                 │ 2 │
                    +   +               ++└───┘
                    +   +            +++
                     + +           ++
                     + +        +++
                      ++      ++
Code for this above example output (CLI version):
import * as geom from "@thi.ng/geom";
import * as mat from "@thi.ng/matrices";
import * as tc from "@thi.ng/text-canvas";

const W = 64;
const H = 32;

// create text canvas
const canvas = new tc.Canvas(W, H, tc.BG_BLACK, tc.STYLE_THIN);

// cube corner vertices
const cube = geom.vertices(geom.center(geom.aabb(1))!);

// edge list (vertex indices)
const edges = [
    [0, 1], [1, 2], [2, 3], [3, 0], [4, 5], [5, 6],
    [6, 7], [7, 4], [0, 4], [1, 5], [2, 6], [3, 7]
];

// animated parameters
let rotx = 0;
let roty = 0;

// 3D transformation matrices
const view = mat.lookAt([], [0, 0, 1], [0, 0, 0], [0, 1, 0]);
const proj = mat.perspective([], 90, W / H, 0.1, 10);
const viewp = mat.viewport([], 0, W, H, 0);

setInterval(() => {
    tc.clear(canvas, true);
    // model rotation matrix
    const model = mat.concat(
        [],
        mat.rotationX44([], rotx += 0.01),
        mat.rotationY44([], roty += 0.03)
    );
    // combined model-view-projection matrix
    const mvp = mat.concat([], proj, view, model);
    // draw cube instances
    // project 3D points to 2D viewport (canvas coords)
    const pts = cube.map((p) => mat.project3([], mvp, viewp, p)!);
    // draw cube edges
    for (let e of edges) {
        const a = pts[e[0]];
        const b = pts[e[1]];
        tc.line(canvas, a[0], a[1], b[0], b[1], "+", tc.FG_WHITE | tc.BG_RED);
    }
    // draw vertex labels
    canvas.format = tc.FG_WHITE | tc.BG_BLUE;
    for (let i = 0; i < 8; i++) {
        const p = pts[i];
        tc.textBox(canvas, p[0] - 1, p[1] - 1, 5, 3, ` ${i} `);
    }
    tc.textBox(
        canvas,
        2, 1, 24, -1,
        `@thi.ng/text-canvas wireframe cube\n\nx: ${rotx.toFixed(2)}\ny: ${roty.toFixed(2)}`,
        {
            format: tc.FG_BLACK | tc.BG_LIGHT_CYAN,
            padding: [1, 0]
        }
    );
    // draw canvas
    console.clear();
    // output as ANSI formatted string
    console.log(tc.toString(canvas, tc.FMT_ANSI16));
    // output as plain text
    // console.log(tc.toString(canvas));
}, 15);Karsten Schmidt
© 2020 Karsten Schmidt // Apache Software License 2.0