


This project is part of the @thi.ng/umbrella monorepo.
Graphviz document abstraction as vanilla JS objects and serialization to DOT format.
Provides several interfaces covering a large subset of GraphViz options and functions to serialize whole graphs (incl. subgraphs), nodes or edges. Supports both directed and undirected graphs.
Please see the GraphViz DOT guide for further details.
BETA - possibly breaking changes forthcoming
yarn add @thi.ng/dotPackage sizes (gzipped, pre-treeshake): ESM: 768 bytes / CJS: 829 bytes / UMD: 883 bytes
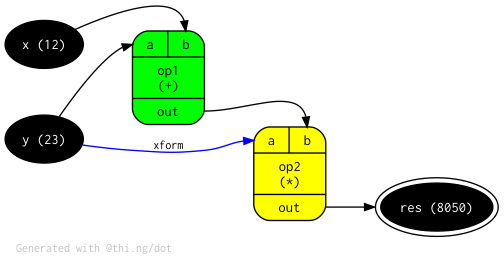
The source code of this example is also available in /test/example.ts.
import { serializeGraph } from "@thi.ng/dot";

// node type style presets
const terminal = {
    color: "black",
    fontcolor: "white",
};

// operator nodes use "Mrecord" shape
// with input and output port declarations
const operator = {
    fillcolor: "yellow",
    shape: "Mrecord",
    ins: { 0: "a", 1: "b" },
    outs: { "out": "out" }
};

serializeGraph({
    directed: true, // default
    // graph attributes
    attribs: {
        rankdir: "LR",
        fontname: "Inconsolata",
        fontsize: 9,
        fontcolor: "gray",
        label: "Generated with @thi.ng/dot",
        labeljust: "l",
        labelloc: "b",
        // node defaults
        node: {
            style: "filled",
            fontname: "Inconsolata",
            fontsize: 11
        },
        // edge defaults
        edge: {
            arrowsize: 0.75,
            fontname: "Inconsolata",
            fontsize: 9
        }
    },
    // graph nodes (the keys are used as node IDs)
    // use spread operator to inject style presets
    nodes: {
        x:   { ...terminal, label: "x (12)" },
        y:   { ...terminal, label: "y (23)" },
        res: { ...terminal, label: "result (8050)", peripheries: 2 },
        op1: { ...operator, fillcolor: "green", label: "op1\n(+)" },
        op2: { ...operator, label: "op2\n(*)" },
    },
    // graph edges (w/ optional ports & extra attribs)
    edges: [
        { src: "x", dest: "op1", destPort: 1 },
        { src: "y", dest: "op1", destPort: 0 },
        { src: "y", dest: "op2", destPort: 0, label: "xform", color: "blue" },
        { src: "op1", srcPort: "out", dest: "op2", destPort: 1 },
        { src: "op2", srcPort: "out", dest: "res"},
    ]
});
Resulting output:
digraph g {
rankdir="LR";
node[style="filled", fontname="Inconsolata", fontsize="11"];
edge[arrowsize="0.75", fontname="Inconsolata", fontsize="9"];
"x"[color="black", fontcolor="white", label="x (12)"];
"y"[color="black", fontcolor="white", label="y (23)"];
"op1"[fillcolor="yellow", shape=Mrecord, label="{ <0> a | <1> b } | op1\n(+) | { <out> out }"];
"op2"[fillcolor="yellow", shape=Mrecord, label="{ <0> a | <1> b } | op2\n(*) | { <out> out }"];
"res"[color="black", fontcolor="white", label="res (805)", peripheries="2"];
"x" -> "op1":"1";
"y" -> "op1":"0";
"op1":"out" -> "op2":"1";
"y" -> "op2":"0"[label="xform", color="blue"];
"op2":"out" -> "res";
}Karsten Schmidt
© 2018 - 2020 Karsten Schmidt // Apache Software License 2.0