This week covers:
- An intro to Git and Github for sharing code
- Command line tools
- Exploratory data analysis with R
Install tools: Ubuntu on Windows, GitHub for Windows, R, and RStudio
- Type
bashin the Start Menu, hit enter, and thenyto install Ubuntu on Windows - If this seems like it's hanging, hit enter
- Create a username and password
- Updates all packages with
sudo apt-get updateandsudo apt-get upgrade
- Check that you have git under bash by typing
git --versionin the terminal - Install GitHub for Windows
- Download and install R from a CRAN mirror
- Download and install RStudio
- Open RStudio and install the
tidyversepackage, which includesdplyr,ggplot2, and more:install.packages('tidyverse', dependencies = T)
- You'll need a plain text editing program
- Atom, Sublime, and Visual Studio Code are all good options
- Complete this free online git course
- Sign up for a free GitHub account
- Then follow this guide to fork your own copy of the course repository
- Clone a copy of your forked repository, which should be located at
[email protected]/<yourusername>/coursework.git, to your local machine - Once that's done, create a new file in the
week1/studentsdirectory,<yourfirstname>.txt(e.g.,jake.txt) - Use
git addto add the file to your local repository - Use
git commitandgit pushto commit and push your changes to your copy of the repository - Then issue a pull request to send the changes back to the original course repository
- Finally, configure a remote repository called
upstreamto point here:
git remote add upstream [email protected]:msr-ds3/coursework
- This will allow you to sync future changes to your fork with:
    git fetch upstream
	git merge upstream/master
- Note: this is equivalent to
git pull upstream master
- A full hour-long introductory video
- More resources from GitHub available here and here
- And here's a handy cheatsheet
- Read through Lifehacker's command line primer
- Do Codecademy's interactive command line tutorial
- See this crash course for more details on commonly used commands
- Check out Software Carpentry's guide to the Unix shell
- Review this wikibook on data analysis on the command line, covering
cut,grep,wc,uniq,sort, etc - Learn awk in 20 minutes
- Check out some more advanced tools for Data Science at the Command Line
- Review intro_command_line.ipynb for an introduction to the command line
- Download one month of the Citibike data:
wget https://s3.amazonaws.com/tripdata/201402-citibike-tripdata.zip - Decompress it:
unzip 201402-citibike-tripdata.zip - Rename the resulting file to get rid of ugly spaces:
mv 2014-02*.csv 201402-citibike-tripdata.csv - See the download_trips.sh file which automates this, and can be run using
bash download_trips.shor./download_trips.sh - Fill in solutions of your own under each comment in citibike.sh
- Start the Code School and DataCamp tutorials (or Hadley's Advanced R if you're a pro)
- References:
- Basic types: (numeric, character, logical, factor)
- Vectors, lists, dataframes: a one page reference and more details
- Cyclismo's more extensive tutorial
- Hadley Wickham's style guide
-
See these Introduction to Counting and Data Wrangling in R slides
-
Review intro_to_r.ipynb for an introduction to R
-
Do the free portion of DataCamp's Data Manipulation in R tutorial
-
Go through chapters 1, 2, and 5 of R for Data Science
-
Fill in solutions to the counting exercises under each comment in citibike.R
-
Take a look at The Anatomy of the Long Tail and think about how to generate figures 1 and 2
-
Additional references
- The dplyr vignette
- Sean Anderson's dplyr and pipes examples (code on github)
- Rstudio's data wrangling cheatsheet
- Review visualization_with_ggplot2.ipynb for an introduction to data visualization with ggplot2
-
Do DataCamp's Data Visualization with ggplot2 (part 1) tutorial
-
Read chapter 3 of R for Data Science
-
Modify and run the
download_trips.shscript to grab all trip data from 2014 (usedos2unixto fix carriage return issues if they arise) -
Run the load_trips.R file to generate
trips.RData -
Write code in plot_trips.R to reproduce and extend the visualizations we made this morning using
trips.RData -
Additional references
- RStudio's ggplot2 cheatsheet
- Sean Anderson's ggplot2 slides (code) for more examples
- The R Graphics Cookbook
- Intro to ggplot2 slides, with somewhat tricky navigation
- Visualizing Data with ggplot2
- The official ggplot2 docs
- Videos on Visualizing Data with ggplot2
- The official ggplot2 docs
- Review combine_and_reshape_in_r.ipynb on joins with dplyr and reshaping with tidyr
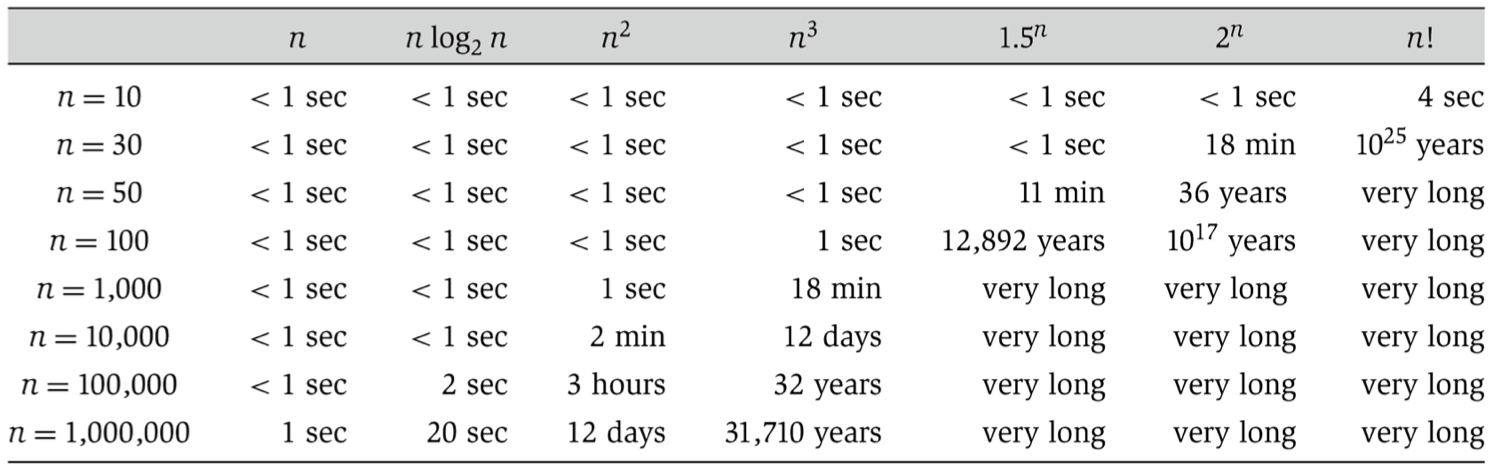
- Sid Sen gave a guest lecture on computational complexity, data structures, and algorithms. Some references:
- Typed notes that cover Sid's lecture
- A beginner's guide to big-O notation
- Another introduction to big-O
- The big-O cheatsheet
- A table from Kleinberg & Tardos for translating asymptotic notation to typical runtimes on modern hardware
- Relevant Khan Academy videos:
- Asymptotic notation
- Big-O for upper bounds
- Big-omega for lower bounds
- Big-theta for tight bounds
- Hash tables on Wikipedia and Spark Notes
- Use the download_movielens.sh script to download the MovieLens data
- Fill in code in the movielens.R file to reproduce the plots from Wednesday's slides
- Sketch out (on paper) how to generate figure 2 from The Anatomy of the Long Tail
- Wrote code to do this in the last section of movielens.R
- Read chapters 12 and 13 of R for Data Science on tidyr and joins
- Do parts 1 and 2 of Datacamp's Cleaning Data in R tutorial
- Additional references:
- The tidyr vignette on tidy data
- The dplyr vignette on two-table verbs for joins
- A visual guide to joins
- Make sure to save your work and push it to GitHub. Do this in three steps:
git addandgit commitand new files to your local repository. (Omit large data files.)git pull upstream masterto grab changes from this repository, and resolve any merge conflicts, commiting the final results.git push origin masterto push things back up to your GitHub fork of the course repository.